
Coinbase x Glassnode:
Charting Crypto Q3 2026
Our quarterly, data-driven market view for institutional investors making allocation and risk decisions in digital assets.
By submitting this form, you are agreeing to our T&Cs & Privacy Notice and for your information to be shared with Coinbase, Inc.
Brought to you by

Institutions rely on Coinbase Institutional to understand, plan, and realize opportunities created by digital assets and web3.

Institutional investors leverage Glassnode's industry-leading market intelligence to drive allocation decisions in digital assets.
The report includes:
Market Overview
Including crypto market cap, cycle performance and correlations to other assets.
Bitcoin
9 slides on slides on BTC including sentiment, supply dynamics, and derivatives positioning.
Ethereum
8 slides on ETH including price trends, staking, L2 activity, and more.
Stablecoins
Insights on stablecoin supply and the assets' increasing utility in financial systems.
Macro View
Fund Flows
Our market outlook
We are neutral for Q2 2026.

Under Pressure
Bitcoin is attempting to shift from a corrective phase toward accumulation, even as a firmer macro liquidity backdrop keeps sentiment in check. The 34-page report is packed with takeaways to help you navigate a pivotal quarter for digital assets. Here are some of them:
Bitcoin sentiment nears capitulation
BTC investor sentiment slid from "Optimism/Anxiety" into "Hope/Fear" through 2Q26 and now sits just above the Capitulation threshold — a level that in past cycles has marked the early stages of a bottoming process rather than further distribution.

ETF outflows show signs of exhausting
US spot bitcoin ETFs saw net outflows through the first half of 2026, but the pace has started to slow. Combined with rising leveraged long positioning, it's a tentative signal that demand is stabilizing — though we'd want a decisive reclaim of resistance before calling it a turn.
Ethereum's base layer absorbs Capital
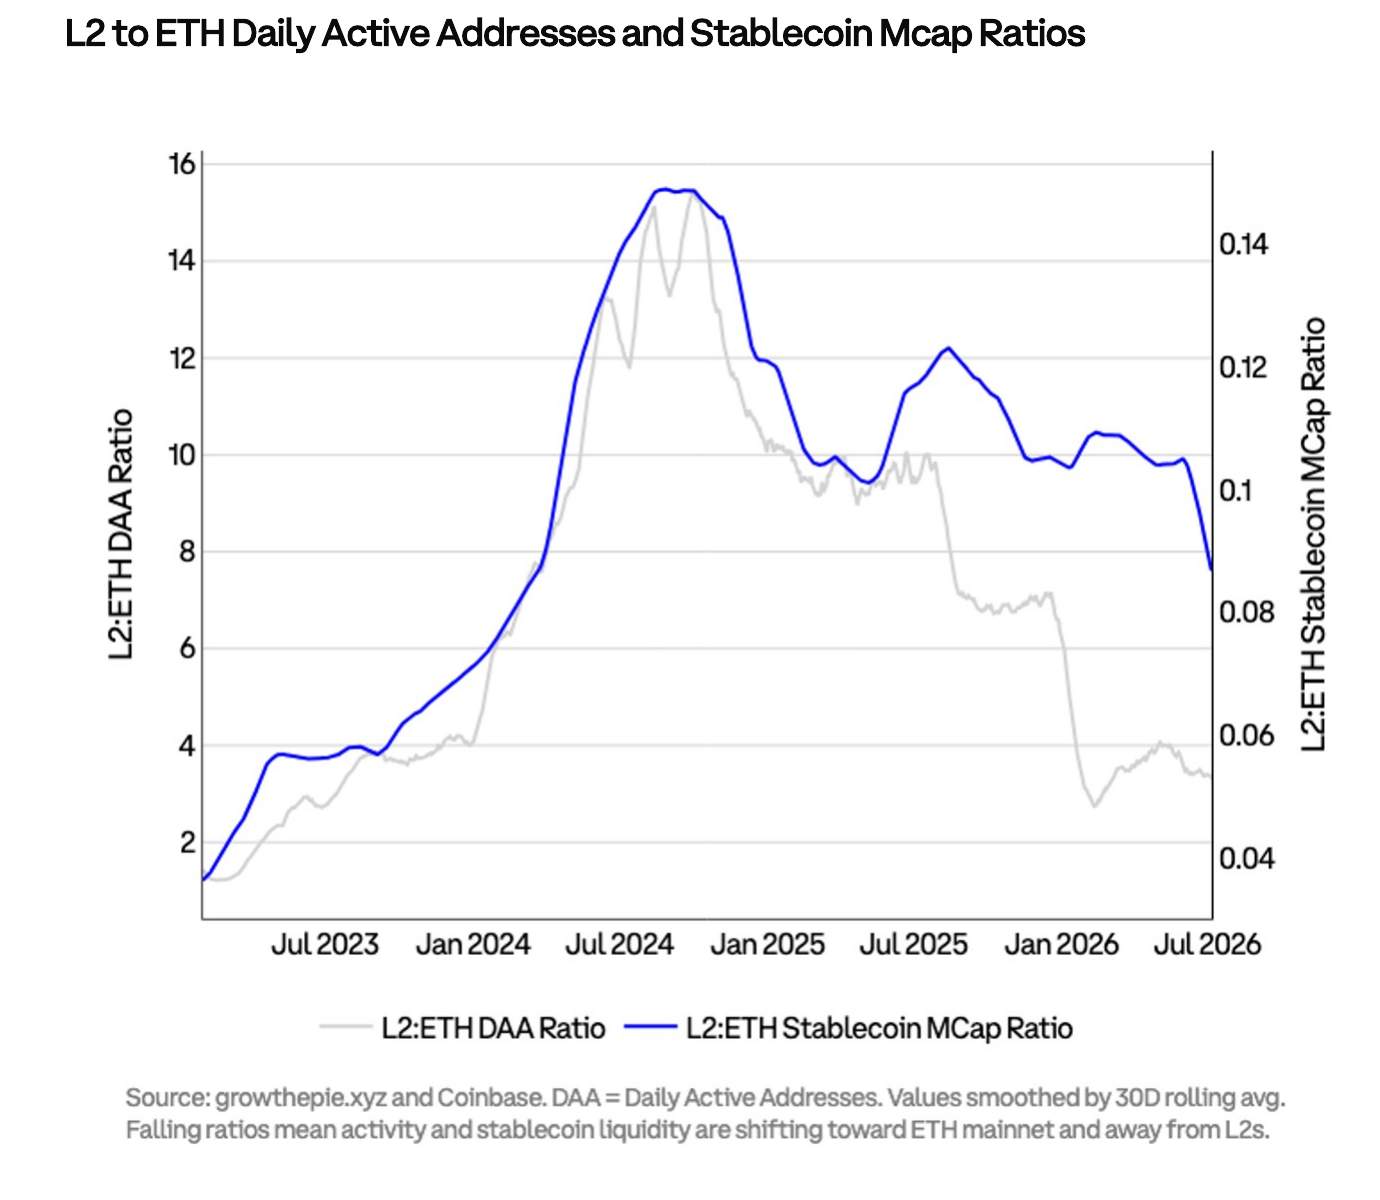
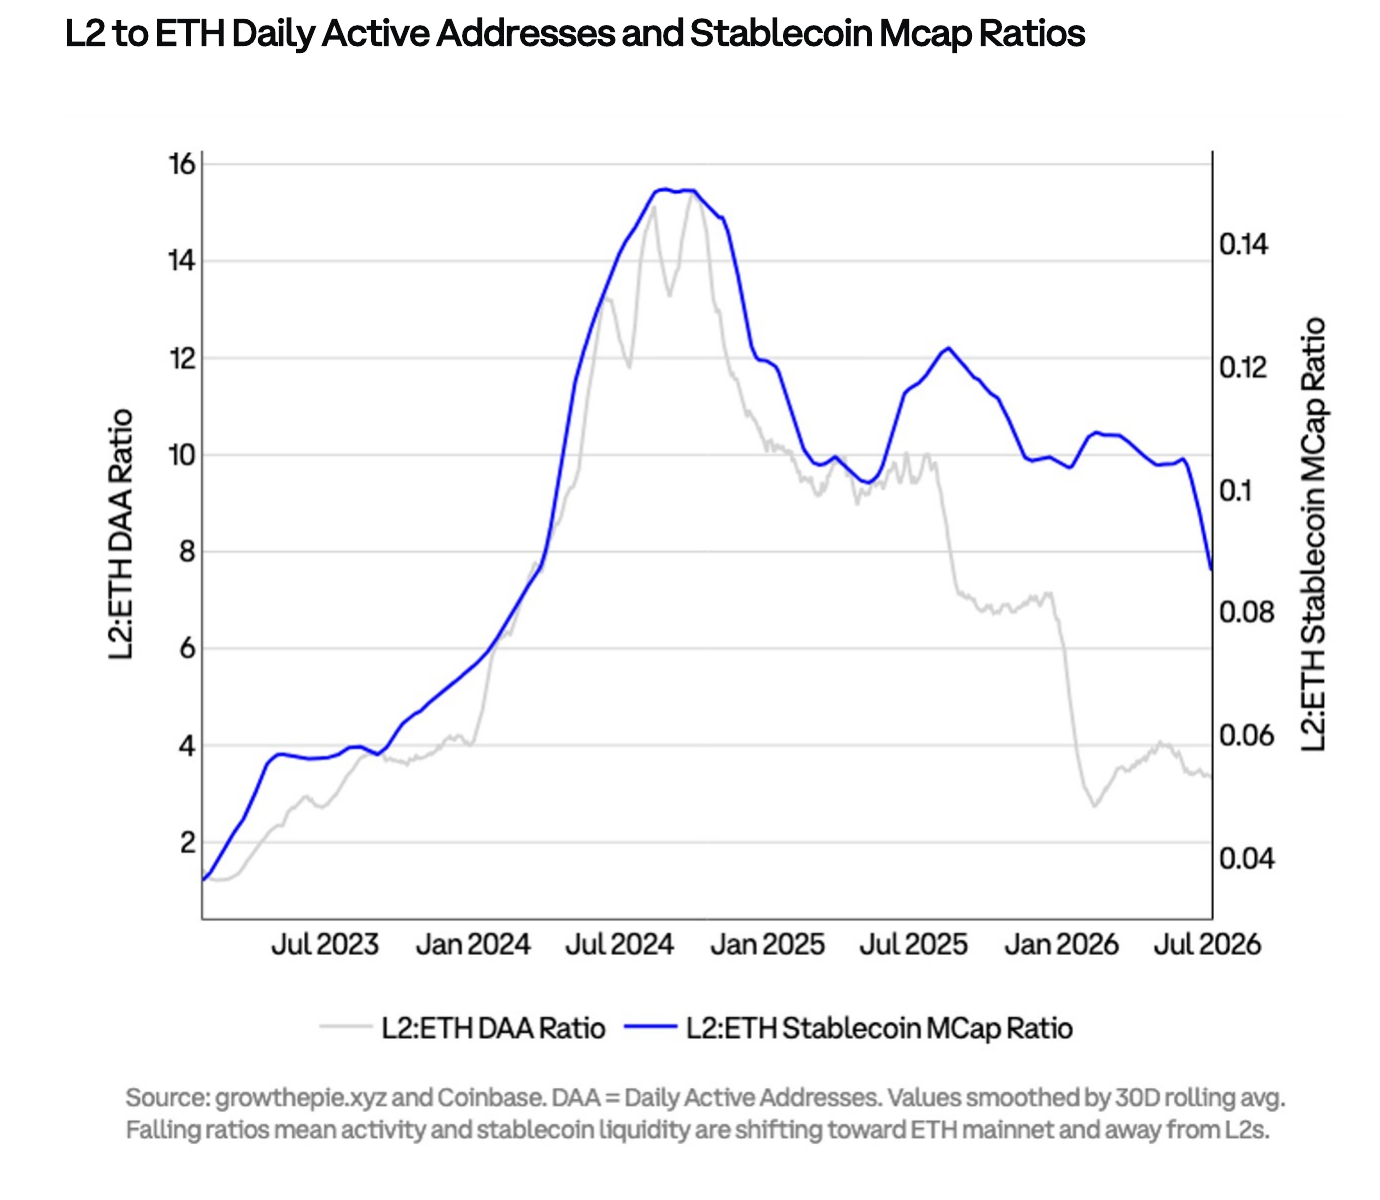
The ratio of L2 to mainnet activity kept falling through 2Q26 as stablecoins and tokenized real-world assets concentrated on Ethereum's base layer instead. Even as ETH price action stays soft, settlement demand at the base layer looks durable.
Trusted by industry leaders







Position before the market moves.
Access our premium systematic framework for professional Bitcoin traders.



© 2023 Glassnode, all rights reserved