Coinbase x Glassnode:
Charting Crypto Q3 2025
Our joint report delivers the essential data and trends that matter the most to institutional crypto investors – with the context to act decisively.
By submitting this form, you are agreeing to our T&Cs & Privacy Notice and for your information to be shared with Coinbase, Inc.
Brought to you by

Institutions rely on Coinbase Institutional to understand, plan, and realize opportunities created by digital assets and web3.
Institutional investors leverage Glassnode's industry leading on-chain analytics to more clearly evaluate trading decisions.
The report includes:
Market Overview
Including crypto market cap, cycle performance and correlations to other assets.
Bitcoin
10 slides on BTC including performance, holding patterns, and market trends.
Ethereum
14 slides on ETH iIncluding price trends, staking, Layer 2 activity, and more.
Stablecoins
Insights on record-high stablecoin supply and their increasing utility in financial systems.
Macro View
Insights on record-high stablecoin supply and their increasing utility in financial systems.
Exclusive Contributions
From partners including Grayscale, Bitwise Asset Management and ParaFi.
Get our market outlook
We are constructive for Q3 2025.
New highs, improving macro, and regulatory tailwinds
Crypto markets have bounced back faster than expected, with Bitcoin setting new all-time highs in May and July. Across 44 slides, in this report we cover the forces driving this rally — from macro policy shifts to renewed institutional demand. Here are some of the many takeaways:
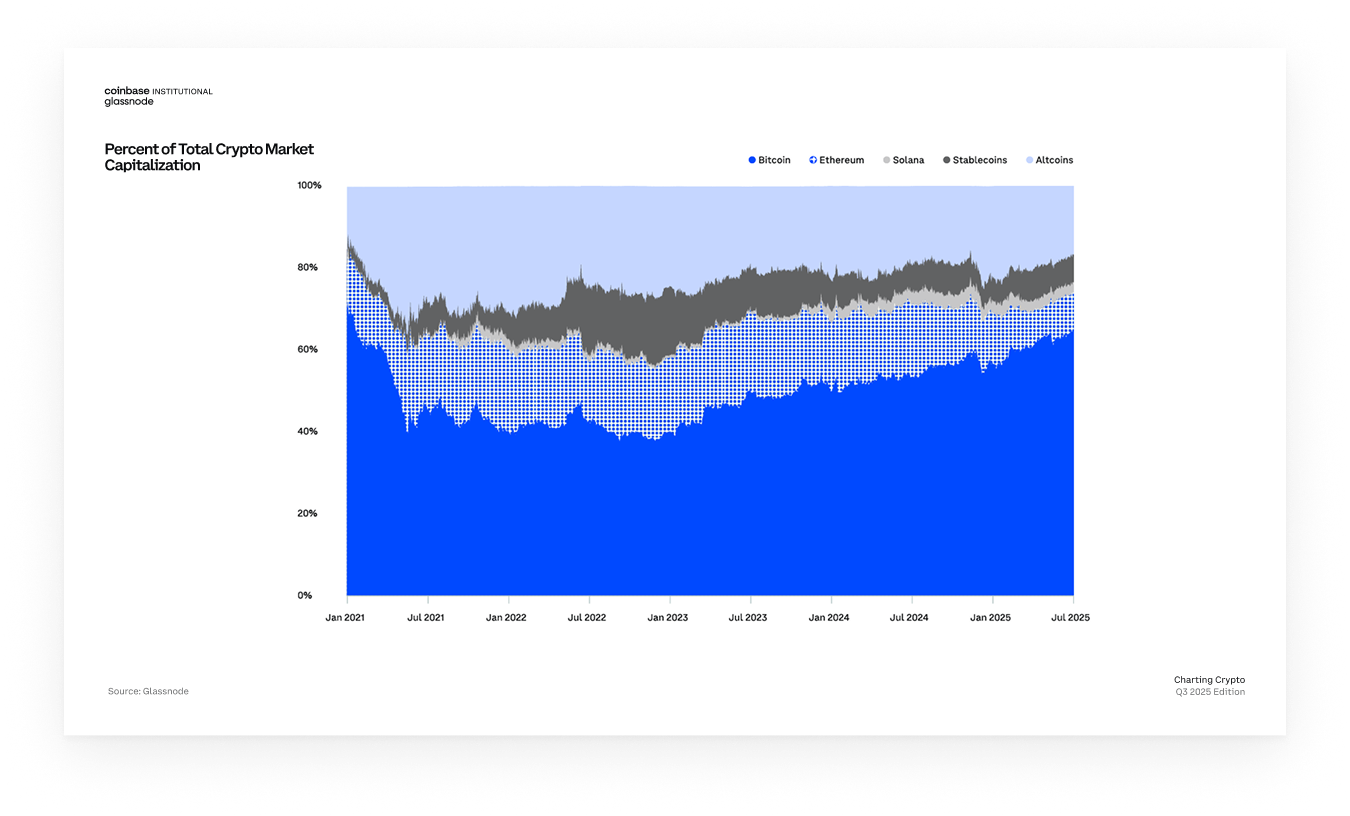
Bitcoin reclaims market dominance
In Q2 2025, Bitcoin’s dominance surged to 64% — its highest level since early 2021. As risk appetite narrowed, investors rotated into blue-chip tokens, with Ethereum and Solana also gaining ground in total crypto market cap share.
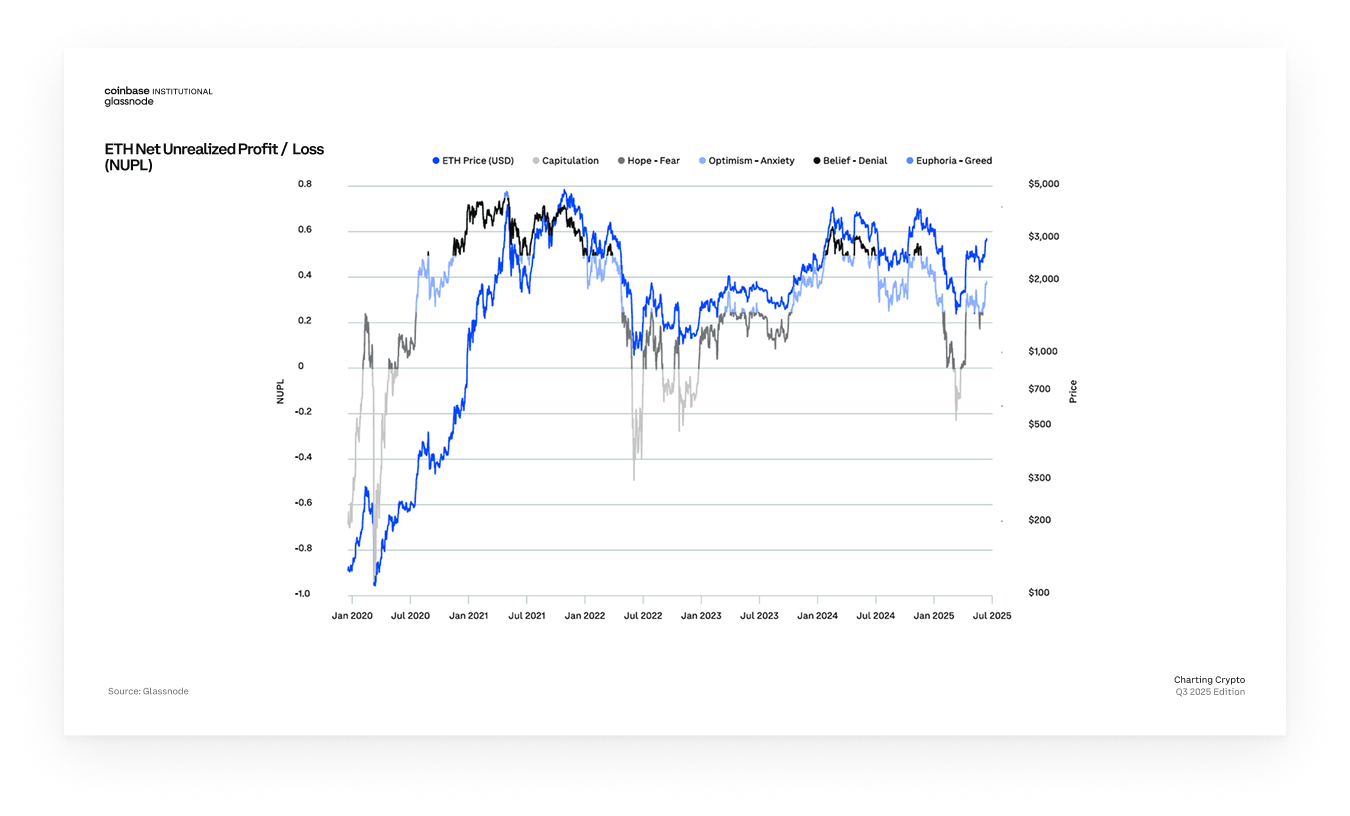
Ethereum marks key turning point
ETH sentiment flipped in Q2 as over $1.7B flowed into ETH ETFs, reversing Q1 outflows. Over 40M ETH were at a loss at the end of Q1, dropping to under 10M by the close of Q2.
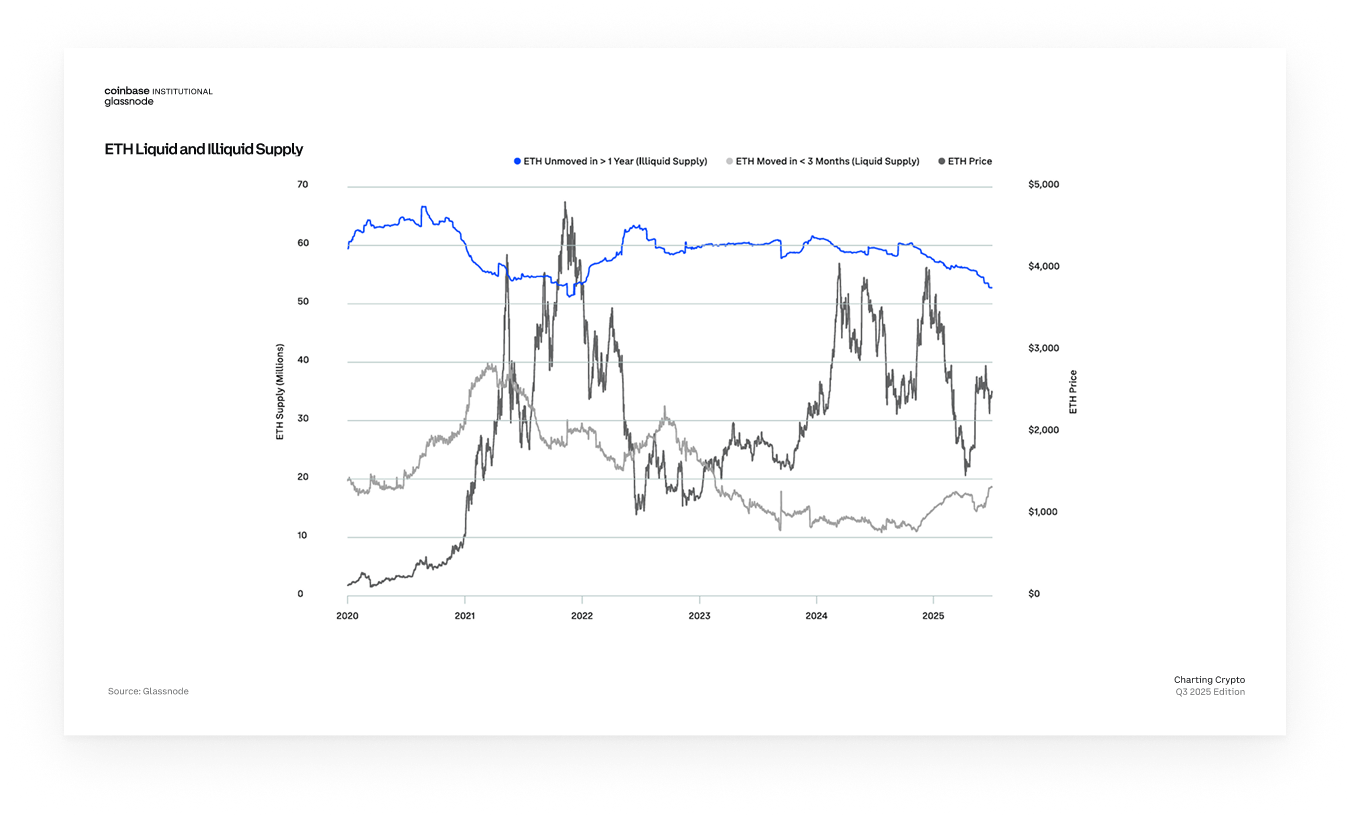
ETH Long-term holders sold into strength
ETH liquid supply increased 8% in Q2, while illiquid supply fell 6%, indicating that some long-term holders used market strength as an opportunity to sell to newer entrants.
Trusted by industry leaders
Want to access our unified trading signals
for the digital asset market?
for the digital asset market?
Get in touch with Glassnode product experts today. We help you take the first step in leveraging on-chain data to maximize your outcomes.


© 2023 Glassnode, all rights reserved